
Advertisement
-
Published Date
January 26, 2023This ad was originally published on this date and may contain an offer that is no longer valid. To learn more about this business and its most recent offers, click here.
Ad Text
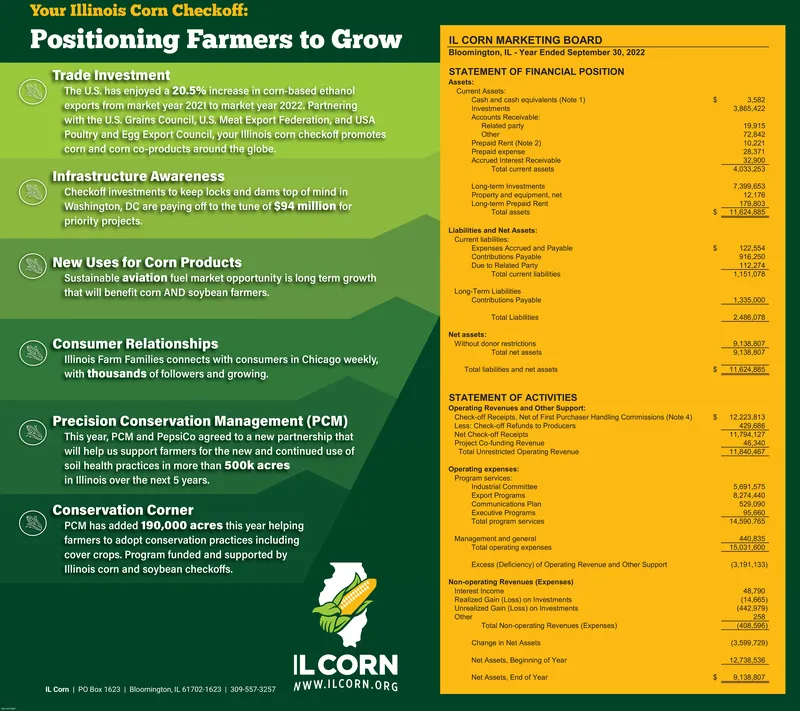
Your Illinois Corn Checkoff: Positioning Farmers to Grow Trade Investment The U.S. has enjoyed a 20.5% increase in corn-based ethanol exports from market year 2021 to market year 2022. Partnering with the U.S. Grains Council, U.S. Meat Export Federation, and USA Poultry and Egg Export Council, your Illinois corn checkoff promotes corn and corn co-products around the globe. Infrastructure Awareness Checkoff investments to keep locks and dams top of mind in Washington, DC are paying off to the tune of $94 million for priority projects. New Uses for Corn Products Sustainable aviation fuel market opportunity is long term growth that will benefit corn AND soybean farmers. Consumer Relationships Illinois Farm Families connects with consumers in Chicago weekly, with thousands of followers and growing. Precision Conservation Management (PCM) This year, PCM and PepsiCo agreed to a new partnership that will help us support farmers for the new and continued use of soil health practices in more than 500k acres in Illinois over the next 5 years. Conservation Corner PCM has added 190,000 acres this year helping farmers to adopt conservation practices including cover crops. Program funded and supported by Illinois corn and soybean checkoffs. IL Corn | PO Box 1623 | Bloomington, IL 61702-1623 | 309-557-3257 IL CORN WWW.ILCORN.ORG IL CORN MARKETING BOARD Bloomington, IL-Year Ended September 30, 2022 STATEMENT OF FINANCIAL POSITION Assets: Current Assets: Cash and cash equivalents (Note 1) Investments Accounts Receivable: Related party Other Prepaid Rent (Note 2) Prepaid expense Accrued Interest Receivable Total current assets Long-term Investments Property and equipment, net Long-term Prepaid Rent Total assets Liabilities and Net Assets: Current abilities: Expenses Accrued and Payable Contributions Payable Due to Related Party Total current liabilities Long-Term Liabilities Contributions Payable Total Liabilities Net assets: Without donor restrictions Total net assets Total abilities and not assets STATEMENT OF ACTIVITIES Operating Revenues and Other Support: Check-off Receipts, Net of First Purchaser Handling Commissions (Note 4) Less: Check-off Refunds to Producers Net Check-off Receipts Project Co-funding Revenue Total Unrestricted Operating Revenue Operating expenses: Program services: Industrial Committee Export Programs Communications Plan Executive Programs Total program services Management and general Total operating expenses Excess (Deficiency) of Operating Revenue and Other Support Non-operating Revenues (Expenses) Interest Income Realized Gain (Loss) on Investments Unrealized Gain (Loss) on Investments Other Total Non-operating Revenues (Expenses) Change in Net Asse Net Assets, Beginning of Year Net Assets. End of Year $ $ $ $ $ S 3,582 3,865,422 19,915 72.842 10.221 28,371 32,900 4,033,253 7,399,653 12.176 179,803 11.624 885 122,554 916,250 112,274 1,151,078 1.335.000 2.486,078 9,138,807 9,138,807 11,624,885 12,223,813 429,686 11,794,127 46,340 11,840,467 5,691,575 8,274,440 529,090 95.660 14,590,765 440,835 15.031.600 (3,191,133) 48,790 (14,665) (442,979) 258 (408,596) (3) 12.738,536 9.138,807 Your Illinois Corn Checkoff : Positioning Farmers to Grow Trade Investment The U.S. has enjoyed a 20.5 % increase in corn - based ethanol exports from market year 2021 to market year 2022. Partnering with the U.S. Grains Council , U.S. Meat Export Federation , and USA Poultry and Egg Export Council , your Illinois corn checkoff promotes corn and corn co - products around the globe . Infrastructure Awareness Checkoff investments to keep locks and dams top of mind in Washington , DC are paying off to the tune of $ 94 million for priority projects . New Uses for Corn Products Sustainable aviation fuel market opportunity is long term growth that will benefit corn AND soybean farmers . Consumer Relationships Illinois Farm Families connects with consumers in Chicago weekly , with thousands of followers and growing . Precision Conservation Management ( PCM ) This year , PCM and PepsiCo agreed to a new partnership that will help us support farmers for the new and continued use of soil health practices in more than 500k acres in Illinois over the next 5 years . Conservation Corner PCM has added 190,000 acres this year helping farmers to adopt conservation practices including cover crops . Program funded and supported by Illinois corn and soybean checkoffs . IL Corn | PO Box 1623 | Bloomington , IL 61702-1623 | 309-557-3257 IL CORN WWW.ILCORN.ORG IL CORN MARKETING BOARD Bloomington , IL - Year Ended September 30 , 2022 STATEMENT OF FINANCIAL POSITION Assets : Current Assets : Cash and cash equivalents ( Note 1 ) Investments Accounts Receivable : Related party Other Prepaid Rent ( Note 2 ) Prepaid expense Accrued Interest Receivable Total current assets Long - term Investments Property and equipment , net Long - term Prepaid Rent Total assets Liabilities and Net Assets : Current abilities : Expenses Accrued and Payable Contributions Payable Due to Related Party Total current liabilities Long - Term Liabilities Contributions Payable Total Liabilities Net assets : Without donor restrictions Total net assets Total abilities and not assets STATEMENT OF ACTIVITIES Operating Revenues and Other Support : Check - off Receipts , Net of First Purchaser Handling Commissions ( Note 4 ) Less : Check - off Refunds to Producers Net Check - off Receipts Project Co - funding Revenue Total Unrestricted Operating Revenue Operating expenses : Program services : Industrial Committee Export Programs Communications Plan Executive Programs Total program services Management and general Total operating expenses Excess ( Deficiency ) of Operating Revenue and Other Support Non - operating Revenues ( Expenses ) Interest Income Realized Gain ( Loss ) on Investments Unrealized Gain ( Loss ) on Investments Other Total Non - operating Revenues ( Expenses ) Change in Net Asse Net Assets , Beginning of Year Net Assets . End of Year $ $ $ $ $ S 3,582 3,865,422 19,915 72.842 10.221 28,371 32,900 4,033,253 7,399,653 12.176 179,803 11.624 885 122,554 916,250 112,274 1,151,078 1.335.000 2.486,078 9,138,807 9,138,807 11,624,885 12,223,813 429,686 11,794,127 46,340 11,840,467 5,691,575 8,274,440 529,090 95.660 14,590,765 440,835 15.031.600 ( 3,191,133 ) 48,790 ( 14,665 ) ( 442,979 ) 258 ( 408,596 ) ( 3 ) 12.738,536 9.138,807